§ Gallery
Selected artifacts.
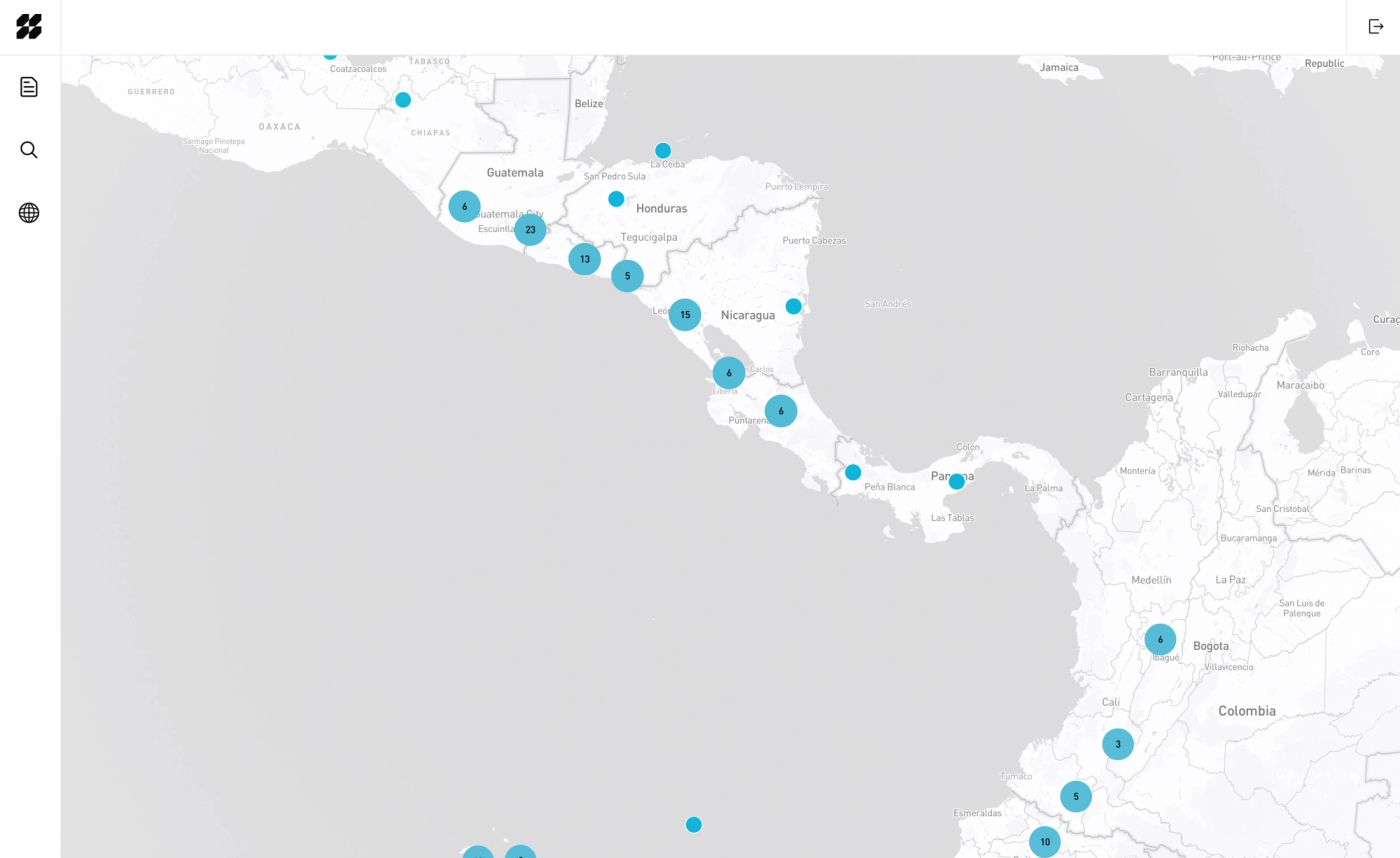
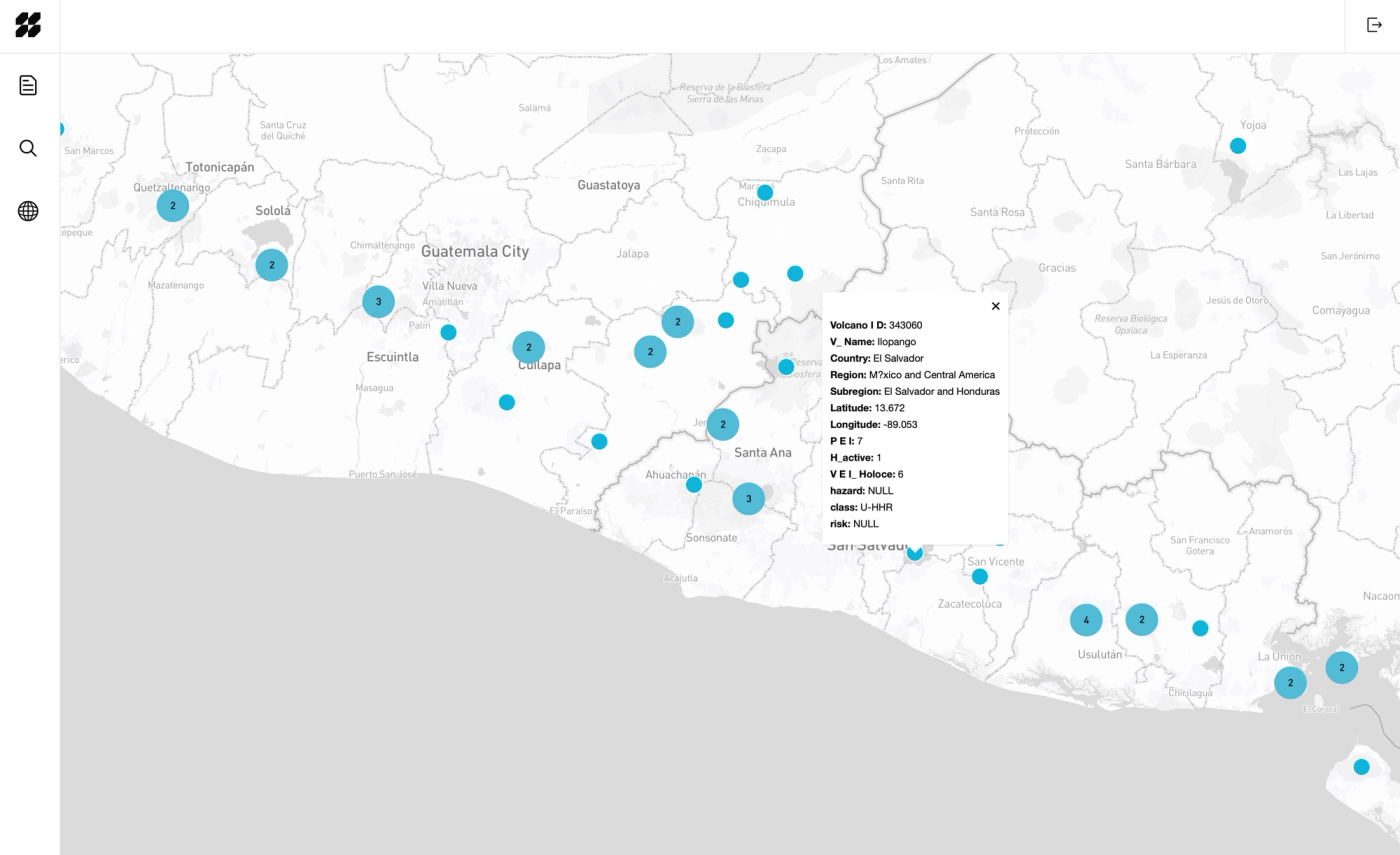
Upload a CSV of city-wide roof permits, and the dashboard plots every project on an interactive map alongside a sortable list of client information.
Product, brand, and engineering — start to ship
Some projects start with a clear ask and end up turning into a category of work we want to keep doing. This was one of those.
A client came to us with a specific problem: they were a roofing company looking for a smarter way to find customers. The data was already public, most cities publish roofing permit records as part of routine permitting, which means there's a constantly-updating list of homes that have recently filed for roof work. Useful information, hard to act on in a CSV. What they needed was a way to see it.
We built them a lead generation dashboard. Upload a CSV of city-wide roof permits, and the dashboard plots every project on an interactive map alongside a sortable list of client information. Sales reps can zoom into a target neighborhood, filter down to recent permits, and reach out to homeowners while the projects are still timely. The data is the same; the workflow is completely different.
Building it sent us down a rabbit hole. Mapping problems are deceptively interesting, there's no single "right" library, and the right tool depends on the shape of the data, the volume of points, the kind of interaction you want, and how much the map is doing versus how much the surrounding UI is doing. So while we were shipping the client's dashboard, we built a small companion tool of our own: drop a GeoJSON file in, see it on a map. Useful for testing different rendering approaches, comparing libraries, and getting a feel for how a dataset actually behaves once it's spatial.
The short version: maps are a category we'd happily do more work in. Lead generation, logistics, environmental data, public records, anything where geography is the unlock, if you've got a project in this space, send us a note. We've already done the homework.
-> hello@virtu-studios.com